The quality and availability of groundwater are increasingly threatened by anthropogenic activities, including oil extraction and inadequate environmental management. This study focuses on the groundwater potential and vulnerability of the Federal University of Petroleum Resources (FUPRE) campus and Agbarho axis in Delta State. The research employs Vertical Electrical Sounding (VES) techniques to assess the subsurface structure and derive geoelectric parameters, such as transverse unit resistance (Tr), longitudinal resistance (ρL), and transverse resistivity (ρt), which inform the groundwater potential and vulnerability. The study also integrates second-order geoelectric indices, including Dar Zarrouk’s parameters, to evaluate aquifer protective capacity using the GOD index and longitudinal conductance. Results indicate that while parts of the study area exhibit promising groundwater potential (high Tr values), the overall aquifer protective capacity is poor, with low longitudinal conductance values suggesting a high susceptibility to contamination. Geoelectric curve types, resistivity contrast, and coefficient of anisotropy further reveal a heterogeneous subsurface with varying permeability and porosity. The GOD index categorizes most of the area as moderately vulnerable to contamination, highlighting the need for enhanced groundwater management. This study underscores the importance of integrating hydrogeological and geophysical data for effective groundwater exploration, management, and protection in regions at risk of contamination.
| Published in | Hydrology (Volume 13, Issue 1) |
| DOI | 10.11648/j.hyd.20251301.13 |
| Page(s) | 22-33 |
| Creative Commons |
This is an Open Access article, distributed under the terms of the Creative Commons Attribution 4.0 International License (http://creativecommons.org/licenses/by/4.0/), which permits unrestricted use, distribution and reproduction in any medium or format, provided the original work is properly cited. |
| Copyright |
Copyright © The Author(s), 2025. Published by Science Publishing Group |
Groundwater Potential, Electrical Resistivity, Aquifer Vulnerability, Dar Zarouk Parameter, GOD Index, FUPRE
Total longitudinal unit conductance (mhos) | Overburden protective capacity classification |
|---|---|
<0.10 | Poor |
0.1-0.19 | Weak |
0.2-0.69 | Moderate |
0.7-4.9 | Good |
5-10 | Very good |
>10 | Excellent |
VES | latitude longitude | Resistivity (Ωm) | Layer thickness (m) | Layer depth (m) | Curve type | No of layer | |||||||||
|---|---|---|---|---|---|---|---|---|---|---|---|---|---|---|---|
ρ1 | ρ2 | ρ3 | ρ4 | h1 | h2 | h3 | h4 | d1 | d2 | d3 | d4 | ||||
1 | 1456.9 | 727.5 | 17117.8 | 186878 | 3.2 | 6.4 | 28.9 | ∞ | 3.2 | 9.6 | 38.5 | ∞ | HA | 4 | |
2 | 642 | 2320.8 | 732.2 | 213.5 | 0.6 | 3.5 | 38 | ∞ | 0.6 | 4.1 | 42.1 | ∞ | KQ | 4 | |
3 | 1317.8 | 694.9 | 2293.5 | 149.2 | 2.4 | 7.9 | 16.4 | ∞ | 2.4 | 10.3 | 26.7 | ∞ | AK | 4 | |
4 | 1025.3 | 2922.8 | 876.9 | 542.9 | 0.6 | 3.2 | 31.9 | ∞ | 0.6 | 3.8 | 35.7 | ∞ | KQ | 4 | |
5 | 1852.7 | 2730.3 | 1151.5 | 575 | 0.8 | 2.7 | 43.6 | ∞ | 0.8 | 3.5 | 47.1 | ∞ | KQ | 4 | |
6 | 131.8 | 22.8 | 483.8 | 2072.7 | 2.9 | 6.6 | 12 | ∞ | 2.9 | 9.6 | 21.5 | ∞ | HA | 4 | |
7 | 280.2 | 1589.4 | 312.9 | 389.2 | 1.4 | 8.6 | 33.6 | ∞ | 1.4 | 10 | 43.7 | ∞ | KH | 4 | |
8 | 1640.3 | 2232 | 766.4 | 798 | 1.4 | 3.7 | 41.2 | ∞ | 1.4 | 5.2 | 46.3 | ∞ | KH | 4 | |
9 | 215.3 | 729.5 | 2047.5 | 1543 | 0.7 | 5 | 20.9 | ∞ | 0.7 | 5.7 | 26.6 | ∞ | AK | 4 | |
10 | 954 | 1302.9 | 1194 | 987 | 1 | 8 | 31 | ∞ | 1 | 9 | 40 | ∞ | KQ | 4 | |
11 | 608.3 | 303.7 | 624.8 | 1016.5 | 1.6 | 4.6 | 38.5 | ∞ | 1.6 | 6.2 | 44.7 | ∞ | HA | 4 | |
12 | 718.8 | 1653.3 | 1623.8 | 27.7 | 1 | 8.1 | 27.7 | ∞ | 1 | 9.1 | 36.8 | ∞ | KQ | 4 | |
13 | 592.1 | 768.5 | 1510.1 | 466.3 | 1 | 8.5 | 28.7 | ∞ | 1 | 9.5 | 38.2 | ∞ | AK | 4 | |
14 | 639.3 | 997.4 | 855.8 | 750.3 | 0.9 | 12 | 28.7 | ∞ | 0.9 | 12.9 | 41.6 | ∞ | KQ | 4 | |
15 | 376 | 1145.3 | 501 | 1125.5 | 0.8 | 6.7 | 33.8 | ∞ | 0.8 | 7.5 | 41.3 | ∞ | KH | 4 | |
16 | 591 | 1540.7 | 707.1 | 1155.7 | 0.7 | 8.6 | 19.6 | ∞ | 0.7 | 9.3 | 28.9 | ∞ | KH | 4 | |
17 | 1856.9 | 1229.6 | 504.3 | 1.3 | 42 | ∞ | 1.3 | 43.3 | ∞ | ∞ | Q | 3 | |||
18 | 1411.7 | 1079.8 | 878.1 | 848.4 | 1 | 12.8 | 32.6 | ∞ | 1 | 13.8 | 46.4 | ∞ | QH | 4 | |
19 | 1422.7 | 1166.8 | 651.7 | 1 | 40.5 | ∞ | 1 | 41.5 | ∞ | ∞ | Q | 3 | |||
20 | 1310 | 1080 | 2355.1 | 223.7 | 0.9 | 9.8 | 19.1 | ∞ | 0.9 | 10.7 | 29.8 | ∞ | HK | 4 | |
21 | 817.7 | 1837.6 | 1704.1 | 460.3 | 1.2 | 12 | 17.5 | ∞ | 1.2 | 13.2 | 30.7 | ∞ | KQ | 4 | |
22 | 466.6 | 2863.3 | 486.2 | 366.4 | 0.7 | 2.6 | 40 | ∞ | 0.7 | 3.3 | 43.3 | ∞ | KQ | 4 | |
23 | 531.9 | 797.4 | 1252.8 | 294.8 | 1 | 7.3 | 20.8 | ∞ | 1 | 8.3 | 29.1 | ∞ | AK | 4 | |
24 | 1004.2 | 2510.8 | 645.2 | 439.3 | 0.7 | 3.5 | 18.9 | ∞ | 0.7 | 4.2 | 23.1 | ∞ | KQ | 4 | |
25 | 1840.6 | 1117.3 | 849 | 484 | 2.6 | 7.9 | 20.9 | ∞ | 2.6 | 10.5 | 31.4 | ∞ | 4 | ||
26 | 427.2 | 258.7 | 251.8 | 1312.2 | 1.4 | 7.5 | 15.2 | ∞ | 1.4 | 8.9 | 24.1 | ∞ | QH | 4 | |
27 | 529.6 | 1376.9 | 701.6 | 439.9 | 1.1 | 8.1 | 20.9 | ∞ | 1.1 | 9.2 | 30.1 | ∞ | KQ | 4 | |
28 | 1361.6 | 1947.9 | 493.8 | 391.5 | 0.9 | 4.6 | 20.1 | ∞ | 0.9 | 5.5 | 25.6 | ∞ | KQ | 4 | |
29 | 483.7 | 1163.7 | 1611 | 1111.3 | 1 | 7.2 | 29.9 | ∞ | 1 | 8.2 | 38.1 | ∞ | AK | 4 | |
30 | 560.6 | 1695 | 1539.9 | 1483.4 | 0.8 | 14.1 | 19.9 | ∞ | 0.8 | 14.9 | 34.8 | ∞ | KQ | 4 | |
31 | 767.4 | 477.6 | 1131.1 | 737.1 | 1.9 | 12.6 | 29.1 | ∞ | 1.9 | 14.5 | 43.6 | ∞ | HK | 4 | |
32 | 555.1 | 1597.4 | 1344.3 | 905.8 | 0.9 | 8 | 30.2 | ∞ | 0.9 | 8.9 | 39.1 | ∞ | KQ | 4 | |
33 | 472.8 | 736.5 | 2095.3 | 401.9 | 0.7 | 13.2 | 18.9 | ∞ | 0.7 | 13.9 | 32.8 | ∞ | AK | 4 | |
34 | 541.4 | 977.6 | 489 | 1241.5 | 1.3 | 11.9 | 19.4 | ∞ | 1.3 | 13.2 | 32.6 | ∞ | KH | 4 | |
35 | 235.4 | 1243.4 | 603 | 879.4 | 0.7 | 7.3 | 41.3 | ∞ | 0.7 | 8 | 49.3 | ∞ | KH | 4 | |
36 | 406.9 | 1861.4 | 721.7 | 862.3 | 0.7 | 4.9 | 29 | ∞ | 0.7 | 5.6 | 34.6 | ∞ | KH | 4 | |
37 | 946.6 | 1099.1 | 773.3 | 816.4 | 1 | 10.8 | 38 | ∞ | 1 | 11.8 | 49.8 | ∞ | KH | 4 | |
38 | 798.6 | 1065.8 | 684.2 | 448.7 | 0.7 | 6.6 | 34.4 | ∞ | 0.7 | 7.3 | 41.7 | ∞ | KH | 4 | |
39 | 663.9 | 965.4 | 1000.3 | 333.7 | 0.5 | 8.8 | 33.7 | ∞ | 0.5 | 9.3 | 43 | ∞ | AK | 4 | |
40 | 457.6 | 784.7 | 2729.3 | 103.3 | 0.5 | 6.8 | 15.1 | ∞ | 0.5 | 7.3 | 22.4 | ∞ | AK | 4 | |
VES | Longitudinal unit conductance (S), mhos | Transverse unit resistance (Tr), Ω | Average longitudinal resistance (Pl) | Transverse resistivity (t) | Co-efficient of anisotropy (λ) | Refection co-efficient (Rc) | Resistivity contrast (Fc) | G.O.D |
|---|---|---|---|---|---|---|---|---|
1 | 0.004 | 9318.08 | 2184.4 | 12849.5 | 0.333 | 0.918 | 0.042 | 0.38 |
2 | 0.001 | 385.2 | 642 | 660.9 | 0.383 | 0.567 | 3.170 | 0.48 |
3 | 0.005 | 8652.43 | 2012.7 | 1408.7 | 0.401 | 0.535 | 0.303 | 0.34 |
4 | 0.001 | 615.18 | 1025.3 | 783.6 | 0.397 | 0.481 | 3.333 | 0.48 |
5 | 0.001 | 8853.97 | 4583 | 1065.9 | 0.203 | 0.191 | 2.371 | 0.43 |
6 | 0.034 | 6338.3 | 638.4 | 270.0 | 0.680 | 0.622 | 0.047 | 0.19 |
7 | 0.005 | 392.28 | 280.2 | 240.6 | 0.374 | 0.700 | 5.080 | 0.56 |
8 | 0.001 | 2296.42 | 1640.3 | 682.0 | 0.519 | 0.153 | 2.912 | 0.48 |
9 | 0.006 | 3798.21 | 944.8 | 1608.8 | 0.389 | 0.475 | 0.356 | 0.38 |
10 | 0.004 | 11377.2 | 2256.9 | 925.4 | 0.355 | -0.095 | 1.091 | 0.38 |
11 | 0.029 | 26425.1 | 1536.8 | 538.1 | 0.620 | 0.239 | 0.486 | 0.29 |
12 | 0.004 | 14110.53 | 2372.1 | 1222.3 | 0.402 | -0.009 | 1.018 | 0.38 |
13 | 0.007 | 7124.35 | 1360.6 | 1134.6 | 0.370 | 0.325 | 0.509 | 0.38 |
14 | 0.008 | 12544.17 | 1636.7 | 590.4 | 0.429 | 0.219 | 1.165 | 0.34 |
15 | 0.020 | 24908.11 | 2022.3 | 410.0 | 0.546 | 0.384 | 2.286 | 0.51 |
16 | 0.010 | 27522.88 | 2838.8 | 479.6 | 0.579 | 0.241 | 2.179 | 0.48 |
17 | 0.001 | 2413.97 | 1856.9 | 1192.7 | 0.173 | -0.203 | 2.438 | 0.34 |
18 | 0.006 | 15233.14 | 2491.5 | 616.9 | 0.363 | -0.103 | 1.230 | 0.48 |
19 | 0.001 | 1422.7 | 1422.7 | 1138.7 | 0.155 | -0.099 | 1.790 | 0.34 |
20 | 0.004 | 11763 | 2390 | 1509.5 | 0.406 | 0.371 | 0.459 | 0.34 |
21 | 0.001 | 23032.44 | 817.7 | 971.4 | 1.461 | 0.384 | 1.078 | 0.48 |
22 | 0.002 | 7771.2 | 466.6 | 449.1 | 2.247 | 0.720 | 5.889 | 0.48 |
23 | 0.006 | 6352.92 | 1329.3 | 895.5 | 0.405 | 0.222 | 0.636 | 0.38 |
24 | 0.001 | 702.94 | 585.8 | 527.9 | 0.228 | 0.429 | 3.892 | 0.48 |
25 | 0.004 | 4785.56 | 732.4 | 565.1 | 0.456 | -0.245 | 1.316 | 0.43 |
26 | 0.026 | 2538.33 | 346.3 | 158.8 | 0.552 | -0.014 | 1.027 | 0.45 |
27 | 0.005 | 582.56 | 228.0 | 487.2 | 0.527 | 0.444 | 1.963 | 0.56 |
28 | 0.002 | 1225.44 | 541.6 | 387.7 | 0.641 | 0.177 | 3.945 | 0.56 |
29 | 0.005 | 8862.34 | 1647.4 | 1264.3 | 0.376 | 0.161 | 0.722 | 0.38 |
30 | 0.007 | 24347.98 | 2255.6 | 880.6 | 0.557 | -0.048 | 1.101 | 0.34 |
31 | 0.012 | 7475.82 | 1245 | 754.9 | 0.371 | 0.406 | 0.422 | 0.45 |
32 | 0.004 | 13278.79 | 2152.5 | 1038.3 | 0.397 | -0.086 | 1.188 | 0.38 |
33 | 0.011 | 10052.76 | 1209.3 | 1207.4 | 0.503 | 0.480 | 0.352 | 0.34 |
34 | 0.016 | 21823.86 | 2008 | 291.0 | 0.577 | 0.435 | 1.999 | 0.45 |
35 | 0.003 | 164.78 | 235.4 | 505.2 | 0.296 | 0.682 | 2.062 | 0.64 |
36 | 0.012 | 30334.99 | 2990 | 604.9 | 0.541 | 0.089 | 2.579 | 0.29 |
37 | 0.018 | 42202.28 | 2819 | 590.1 | 0.548 | 0.027 | 1.421 | 0.29 |
38 | 0.001 | 559.02 | 798.6 | 564.4 | 0.310 | 0.143 | 1.558 | 0.48 |
39 | 0.006 | 8827.47 | 1629.3 | 784.0 | 0.355 | 0.018 | 0.965 | 0.38 |
40 | 0.006 | 5564.76 | 1242.3 | 1839.8 | 0.447 | 0.553 | 0.288 | 0.38 |
MAXIMUM | 0.034 | 42202.3 | 4583.0 | 12849.5 | 0.717 | 0.9 | 5.889 | 0.6 |
MINIMUM | 0.001 | 164.8 | 228.0 | 158.8 | 0.301 | -0.2 | 0.042 | 0.2 |
AVERAGE | 0.007 | 10399.5 | 1535.4 | 1102.4 | 0.504 | 0.3 | 1.667 | 0.4 |
AVI | Aquifer Vulnerability Index |
VES | Vertical Electrical Sounding |
GOD | G-index O-index D-index |
FUPRE | Federal University of Petroleum Resources Effurun |
| [1] | AbijaF. Aetal 2018. Characterisation of aquifersinparts of Abia State, Southeastern Nigeria. Earth Science Pakistan, 2(1): 18-22. |
| [2] | Adeniyi, O. O., Olayinka, A. I., & Ojo, J. S. (2013). Delineation of groundwater potential zones using electrical resistivity tomography in a crystalline basement terrain. Journal of African Earth Sciences, 85, 31-41. |
| [3] | Adiatetal (2013). Application of Multi-Criteria Decision Analysis to Geoelectric and Geologic Parameters for Spatial Prediction of Groundwater Resources Potential and Aquifer Evaluation. Pure and Applied Geophysics, |
| [4] | Agoubi Betal (2018), A Mamdani adaptive neural fuzzy inference system for improvement of ground water vulnerability. Groundwater 56 (6): 978 – 985. |
| [5] | Asfahani Jamal (2013). Neogene aquifer properties specified through the interpretation of electrical Resistivity Hydrological sciences journal 58 (2), 468-482. |
| [6] | Chernicoff, Stanley "an introduction to physical geology" (2007). Pearson Education. |
| [7] | Dewashish, K. M., Kumar, P., Singh, V., et al. (2014). Electrical resistivity tomography for Subsurface imaging: A review. Journal of Environmental & Engineering Geophysics, 19(3), 147-159. |
| [8] | Egbai, J. C. (2011). Vertical Electrical Sounding for the investigation of clay deposit in Orerokpe. Delta State. Journal of Emerging Trends in Engineering and Applied Sciences (JETEAS), No. 2 (2), 260 – 265. [in English]. |
| [9] | Egbai, J. C., Oseji, J. O., Ogala, J. E., and Emmanuel, E. D., “Resistivity method applied to aquifer protection study in agbor-obi and environs, Delta state, Nigeria,” Int. J. Appl. Eng. Res. 14(2), 373–383 (2019), |
| [10] | Eyankware, M. O., &Aleke, B. (2021). Geoelectric investigation of anisotropic rock formations in a basement complex terrain, southwestern Nigeria. Journal of Geophysics and Engineering, 18(3), 055501. |
| [11] | Eyankware, M. O., Omosanya, K. O., &Adelusi, A. A. (2022). Delineation of groundwater potential zones using geoelectric and hydrogeological parameters in a crystalline basement terrain, southwestern Nigeria. Journal of African Earth Sciences, 193, 104574. |
| [12] | Facazio, D. A., Hill, M. E., & Reilly, T. E. (2002). Aquifer protection in urban and industrial areas. Journal of Hydrology, 263(1-2), 1-13. |
| [13] | Falowo Olumuyiwa O. Opeyemi A. Bamoyegun, (2023) AHP GIS-supported overlay/index models in Okeigbo, southwestern Nigeria, for groundwater susceptibility zonation. HydroResearch (6) 184–202. |
| [14] | Foster S. S. D et al (2002). Quality protection groundwater: guide for water service Companies World Bank, Washington, DC, Municipal Authorities and Environment Agencies. |
| [15] | George, N. J. (2021). Modelling the trends of resistivity gradient in Hydrogeological units: a Case study of alluvial environment. Model. Earth Syst. Environ. 7, 95e104. |
| [16] | George, N. J. et. al., (2021b). Modelling the effect of geo-matrix conduction on the Bulk and pore water resistivity in hydrogeological sedimentary beddings. Model. Earth Syst. Environ. |
| [17] | Henriet JP (1976) Direct application of the DarZarrouk parameters in ground water, surveys. Geophys Prospect 24: 334–353. |
| [18] | Isaac O. Olaniyan (2020) Estimation of Aquifer Protective Capacity, Soil Corrosivity and Dar Keller, G. V., & Frischnecht, F. C. (1966). Electrical methods in geophysical prospecting. Pergamon Press. |
| [19] | Maillet R., (1947) “The Fundamental Equations of Electrical Prospecting,” Geophysics, Vol.12, No. 4, pp. 529-556. |
| [20] | Makeig S. K (1982). Natural Buffers for Sludge Leachate Stabilization |
| [21] | Nafez, B. A., Sultan, S. M., & Gad, S. (2010). Integrated geophysical and hydrogeological studies to delineate groundwater potential zones in the Northern Nile Valley, Egypt. Journal of Applied Geophysics, 70(2), 151-162. |
| [22] | Okonkwo, J. E. and Egbai, J. C. (2022). Determination of groundwater potential Using electrical resistivity survey and borehole logging in sites I and III of delta state university, Abraka Nigeria. |
| [23] | Oladapo M. J., and Afuda F. I., (2017). Hydrogeophysical study of parts of Charnockite terrain of Akure South western Nigeria. Global Journal of pure and Applied sciences. |
| [24] | Oladapo, M. I., &Akintorinwa, O. J. (2007). Aquifer protective capacity of geologic formations in southwestern Nigeria. Journal of Environmental Hydrology, 15(2), 1-12. |
| [25] | Oladunjoye, M. A., and Jekayinfa, S., (2015): Efficacy of Hummel (Modified Schlumberger) Arrays of Vertical Electrical Sounding. International Journal of Geophysics. |
| [26] | Olayinka, A. I., & Oyedele, K. E. (2019). Geoelectric investigation of groundwater potential in a crystalline basement terrain. Journal of African Earth Sciences, 155, 103-115. |
| [27] | Oni et al., (2017) Ground water vulnerability assessment using hydrogeologic and Geoelectric layer susceptibility indexing at Igbara Oke, Southwestern Nigeria. NRIAGJA stron Geophys 6(2): 452–458. |
| [28] | Oseji J. O and Egbai J. C (2018); electrical resistivity survey for groundwater potential and estimation of clay deposit in aragba-okpe, okpe local Government area, delta state Nigeria. PERIODYK NAUKOWY AKADEMII POLONIJNEJ. 31 (2018) nr 6. |
| [29] | Oseji, J. O. and Egbai, J. C., “Aquifer characterization based on geoelectric survey data in Issele-Uku, Delta state, Nigeria,” Am. Inst. Phys. Adv. 9, 085124-1–085124-11 (2019a). |
APA Style
Babasola, O. V., Infeanyi, N. G. (2025). Assessment of Groundwater Potential and Vulnerability Using Electrical Resistivity Techniques: A Case Study of the FUPRE Campus and Agbarho Axis, Delta State, Nigeria. Hydrology, 13(1), 22-33. https://doi.org/10.11648/j.hyd.20251301.13
ACS Style
Babasola, O. V.; Infeanyi, N. G. Assessment of Groundwater Potential and Vulnerability Using Electrical Resistivity Techniques: A Case Study of the FUPRE Campus and Agbarho Axis, Delta State, Nigeria. Hydrology. 2025, 13(1), 22-33. doi: 10.11648/j.hyd.20251301.13
AMA Style
Babasola OV, Infeanyi NG. Assessment of Groundwater Potential and Vulnerability Using Electrical Resistivity Techniques: A Case Study of the FUPRE Campus and Agbarho Axis, Delta State, Nigeria. Hydrology. 2025;13(1):22-33. doi: 10.11648/j.hyd.20251301.13
@article{10.11648/j.hyd.20251301.13,
  author = {Olaseni Victor Babasola and Nmoka Goodluck Infeanyi},
  title = {Assessment of Groundwater Potential and Vulnerability Using Electrical Resistivity Techniques: A Case Study of the FUPRE Campus and Agbarho Axis, Delta State, Nigeria
},
  journal = {Hydrology},
  volume = {13},
  number = {1},
  pages = {22-33},
  doi = {10.11648/j.hyd.20251301.13},
  url = {https://doi.org/10.11648/j.hyd.20251301.13},
  eprint = {https://article.sciencepublishinggroup.com/pdf/10.11648.j.hyd.20251301.13},
  abstract = {The quality and availability of groundwater are increasingly threatened by anthropogenic activities, including oil extraction and inadequate environmental management. This study focuses on the groundwater potential and vulnerability of the Federal University of Petroleum Resources (FUPRE) campus and Agbarho axis in Delta State. The research employs Vertical Electrical Sounding (VES) techniques to assess the subsurface structure and derive geoelectric parameters, such as transverse unit resistance (Tr), longitudinal resistance (ρL), and transverse resistivity (ρt), which inform the groundwater potential and vulnerability. The study also integrates second-order geoelectric indices, including Dar Zarrouk’s parameters, to evaluate aquifer protective capacity using the GOD index and longitudinal conductance. Results indicate that while parts of the study area exhibit promising groundwater potential (high Tr values), the overall aquifer protective capacity is poor, with low longitudinal conductance values suggesting a high susceptibility to contamination. Geoelectric curve types, resistivity contrast, and coefficient of anisotropy further reveal a heterogeneous subsurface with varying permeability and porosity. The GOD index categorizes most of the area as moderately vulnerable to contamination, highlighting the need for enhanced groundwater management. This study underscores the importance of integrating hydrogeological and geophysical data for effective groundwater exploration, management, and protection in regions at risk of contamination.
},
 year = {2025}
}
TY  - JOUR
T1  - Assessment of Groundwater Potential and Vulnerability Using Electrical Resistivity Techniques: A Case Study of the FUPRE Campus and Agbarho Axis, Delta State, Nigeria

AU  - Olaseni Victor Babasola
AU  - Nmoka Goodluck Infeanyi
Y1  - 2025/01/24
PY  - 2025
N1  - https://doi.org/10.11648/j.hyd.20251301.13
DO  - 10.11648/j.hyd.20251301.13
T2  - Hydrology
JF  - Hydrology
JO  - Hydrology
SP  - 22
EP  - 33
PB  - Science Publishing Group
SN  - 2330-7617
UR  - https://doi.org/10.11648/j.hyd.20251301.13
AB  - The quality and availability of groundwater are increasingly threatened by anthropogenic activities, including oil extraction and inadequate environmental management. This study focuses on the groundwater potential and vulnerability of the Federal University of Petroleum Resources (FUPRE) campus and Agbarho axis in Delta State. The research employs Vertical Electrical Sounding (VES) techniques to assess the subsurface structure and derive geoelectric parameters, such as transverse unit resistance (Tr), longitudinal resistance (ρL), and transverse resistivity (ρt), which inform the groundwater potential and vulnerability. The study also integrates second-order geoelectric indices, including Dar Zarrouk’s parameters, to evaluate aquifer protective capacity using the GOD index and longitudinal conductance. Results indicate that while parts of the study area exhibit promising groundwater potential (high Tr values), the overall aquifer protective capacity is poor, with low longitudinal conductance values suggesting a high susceptibility to contamination. Geoelectric curve types, resistivity contrast, and coefficient of anisotropy further reveal a heterogeneous subsurface with varying permeability and porosity. The GOD index categorizes most of the area as moderately vulnerable to contamination, highlighting the need for enhanced groundwater management. This study underscores the importance of integrating hydrogeological and geophysical data for effective groundwater exploration, management, and protection in regions at risk of contamination.

VL  - 13
IS  - 1
ER  -
Department of Physics, Federal University of Petroleum Resources, Effurun, Nigeria
Department of Physics, Federal University of Petroleum Resources, Effurun, Nigeria
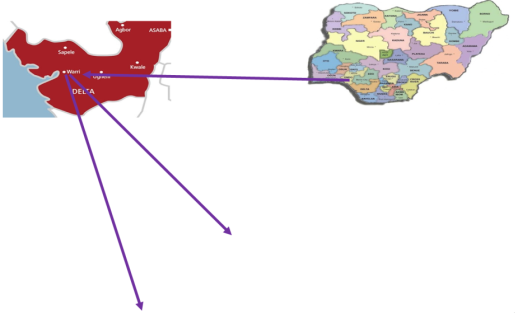
Figure 1. Showing the maps of the delta state in Nigeria with the study area.
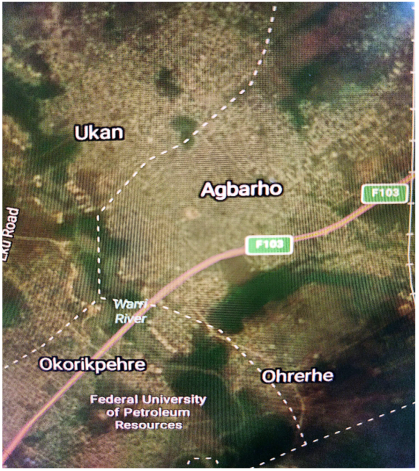
Figure 2. Showing the google map of the study areas (Agbarho and FUPRE).
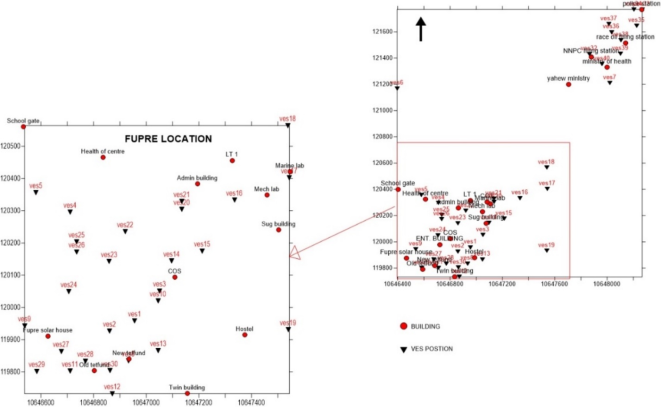
Figure 3. Base Map of study area showing the acquired VES points.
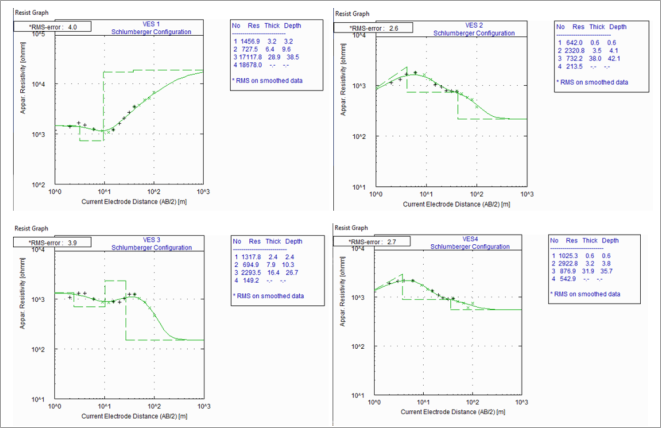
Figure 4. Samples of Derived Geoelctric curves.
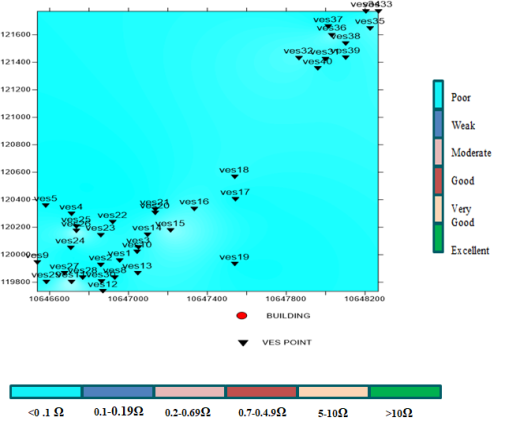
Figure 5. Spatial variation of longitudinal conductance (S) across the study area.
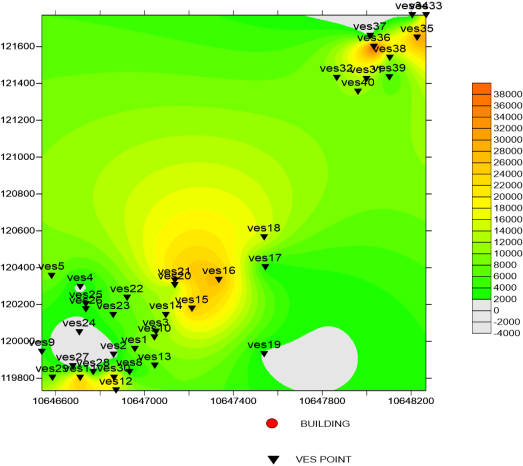
Figure 6. Spatial variation of Transverse unit resistance.
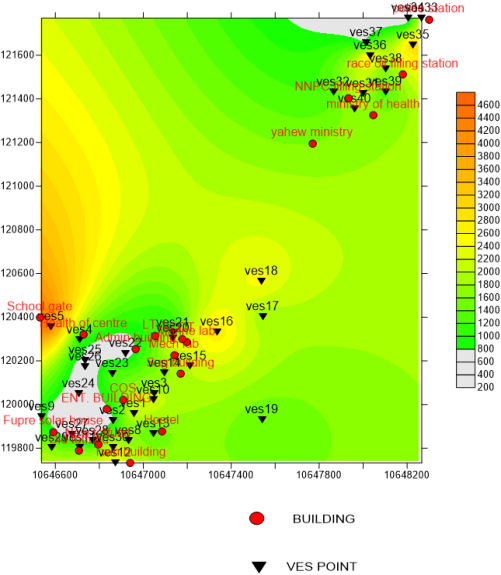
Figure 7. Spatial variation of Average longitudinal resistance (ρL) across the study area.
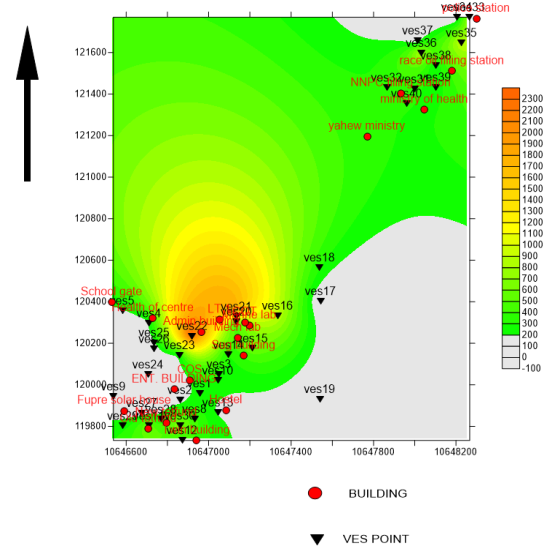
Figure 8. Spatial variation of Transverse Resistivity (Pt) across the study area.
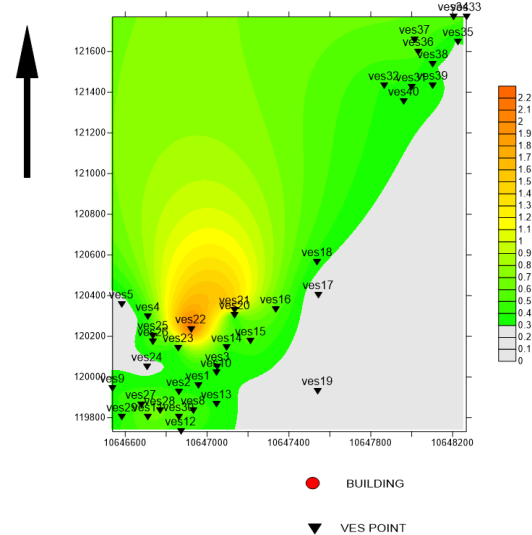
Figure 9. Spatial variation of Coefcient of anisotropy (λ) across the study area.
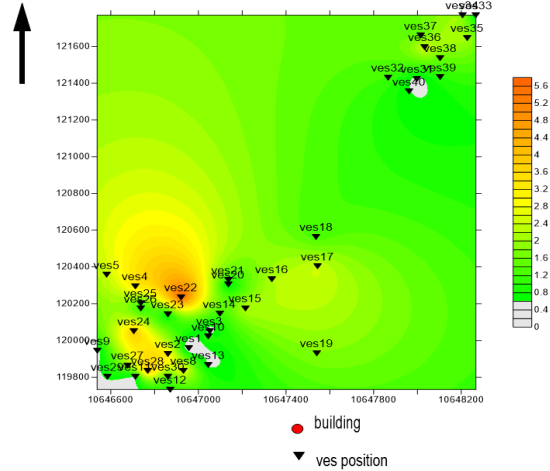
Figure 10. Spatial variation of Resistivity contrast (Fc) across the study area.
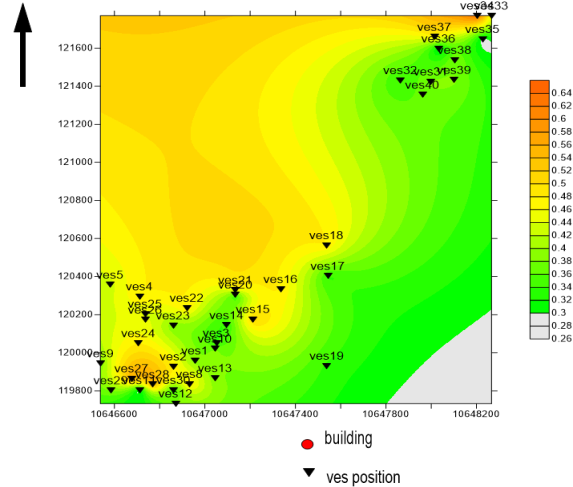
Figure 11. GOD-Index contour map.